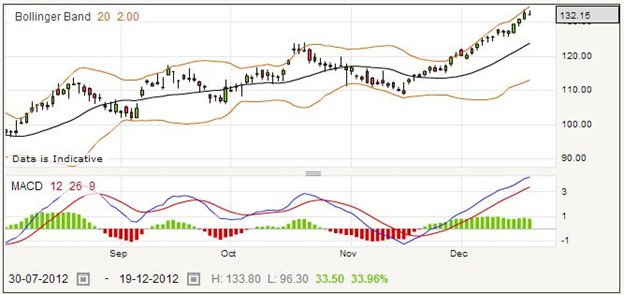
The Henderson Group is a global investment company with headquarters in Dublin, but with London as its principal place of business. You can see from the daily price chart below that the stock has been trending both up and down, with little sideways (or trendless) movement, and that should be good for spread betting and trading.
The company started in 1934 to administer the estates of Lord Faringdon. It diversified into managing pension funds in 1975, and took on management for Pearl Assurance, National Provident Life, London Life, and others. It was first listed on the London Stock Exchange in 1983. The group was re-listed on the London Stock Exchange as the HHG Group in 2003, having been bought by AMP Group five years previously and then de-merging. For financial reasons, in 2008 the Group incorporated in Jersey and established tax residency in the Republic of Ireland.
The company focuses on four principal classes of assets, including property, equities or shares, fixed income or bonds, and private equity. It has offices around the world in Europe, Asia, the US, and Australia, where it is also listed on the Australian Securities Exchange.
As mentioned above, the current daily price chart is well behaved with clear trend indications. However, Henderson has had rocky times on the Stock Exchange. At the end of 2007, it peaked at 234 prior to the plummeting which many companies experienced with the global economic crisis. However Henderson experienced a double-dip, dropping first to 85 with a recovery to 140 before another crash to below 50. It grew fairly steadily to the beginning of 2001 when it peaked at 176 before slumping back to the levels you can see here.
This means that you should be aware that the stock price may not always be well behaved, and take care to ensure that you do not get caught out by any price movements that seem out of character to the current performance.
Henderson Group Rolling Daily
As a financial services company, Henderson has been subject to the ups and downs of the market. It has a diversified portfolio which may help to smooth some of the changes. The current price for a rolling daily bet is 131.87 – 132.53. Say you are bullish on the short term outlook, you may choose to place a buy bet, going long at 132.53 for £30 per point.
Perhaps the price will go up to 140.52 – 141.18, at which time you will decide to take your profits. The starting price for your bet was 132.53, and you closed it out at 140.52 for a gain of 7.99 points. As you staked £30 per point, your bet wins £239.70. Because this is a long bet on a rolling basis, there may have been minor charges made to your account each evening when the bet is rolled over, but usually these are not significant.
Suppose the bet does not work out, and instead of going up the price goes down. You might choose to cut your losses if the price goes down as far as 126.68 – 127.34. The opening price is 132.53, as before, but this time your bet is closed at 126.68, giving you a loss of 5.85 points. Multiplying this by your stake, you would have lost £175.50.
Many spread betters decide to use stop loss orders to protect their positions. With a stop loss order you can control how far your bet goes into a losing position before it is closed for you by your spread betting provider. If you had placed a stop loss order on this bet, you might find that it would be closed for you when the quote was 129.28 – 129.94. In this case the price has gone from a starting price of 132.53 down to a closing price of 129.28, a loss of 3.25 points. Multiplying it by your stake of £30 gives you an overall loss of £97.50.
Henderson Group Futures Bet
The current quotation for a far quarter futures style bet on the Henderson Group is 132.38 – 133.97. Say you performed extensive technical analysis and decided that in a few months time the shares would be trading lower, you might choose to place a sell bet on this company, staking £25 per point at the selling price of 132.38.
For the sake of example, assume that you are proved to be right and the quote goes down to 119.41 – 121.00. This means your short bet would close at 121.00. Taking this away from the opening price of 132.38, you find that you have gained 11.38 points. With a wager of £25 per point, that works out to a profit of £284.50.
Now consider the alternative example, that of a losing trade. Suppose shortly after taking out your short bet the price went up to 137.57 – 139.16. You close the bet and accept your losses. This time you take the starting price of 132.38 away from the closing price of 139.16 to find that you have lost 6.78 points. With the size of wager that you chose, this would amount to £169.50. Note that even though this is a futures style bet, and does not expire for many months, you can still close it at any time you want to.
It is quite common for spread traders to place a stop loss orders when they take out a new bet. This way, the spread betting company will close a losing bet when it reaches a price that you set, and you do not need to tell them to do so. You might find that the stop loss order closed your trade when the quote was 134.98 – 136.57. With an opening price of 132.38 and a closing price of 136.57, you can work out that you have lost 4.19 points. Multiplying by your stake of £25 per point, your total loss works out to £104.75.